
Where the money comes from
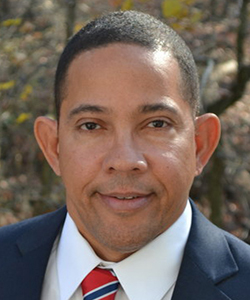
Mike Rogers
United States Congress · 2025–2026 cycle
Mike's money is a mix: 42.5% large gifts, 20.4% small gifts, 7.3% from PACs.
Raised
$11.1M
Spent
$6.8M
Cash on hand
$4.5M
Debts
$0
Large individual gifts ($200+)
$4.6M · 42.5%
Small gifts (under $200)
$2.2M · 20.4%
PACs
$795K · 7.3%
Other
$3.2M · 29.8%
20%
Small gifts
of money came in gifts under $200
7%
PACs
of money came from PACs
73%
Out of state
of itemized individual money came from other states
65%
Ideological/Single-Issue
of PAC money came from this sector
Compared with a typical senator
Across all 11 PAC sectors, 2 sit above what a typical senator takes from that sector.
Ideological/Single-Issue
$516K vs $108K typical
+377%Finance, Insurance & Real Estate
$87K vs $198K typical
−56%Energy & Natural Resources
$53K vs $70K typical
−25%Health
$32K vs $116K typical
−72%Construction
$30K vs $28K typical
+4%Misc Business
$26K vs $74K typical
−66%Transportation
$22K vs $70K typical
−68%Agribusiness
$12K vs $45K typical
−74%Lawyers & Lobbyists
$9K vs $25K typical
−65%Communications/Electronics
$7K vs $67K typical
−90%Defense
$1K vs $44K typical
−98%
Bars to the right mean more than a typical senator; to the left, less.
Follow the PAC money
From PACs
$792K
Committees
149
Share of money
7.2%
vs a typical senator
+57%
- Ideological/Single-Issue65%
- Business35%
11 sectors. Tap one to see the industries inside it, then every committee that gave.
Who gives
Biggest organisations
All 19 organisations whose employees, their families, or PAC gave. People on the left, the PAC on the right.
- Left: employees and their families
- Right: the organisation's PAC
- Republican Jewish Coalition$66K$66K—
- RDV Corp$42K$42K—
- Brodie Generational Capital Partners$37K$37K—
- Schostak Brothers$31K$31K—
- Corrigan Oil$27K$27K—
- AT&T Inc$24K$19K$5K
- Winklevoss Capital Management$24K$24K—
- BGR Group$24K$24K—
- Continuum Ventures$21K$21K—
- Crow Holdings$21K$21K—
- Blackstone Group$20K$20K—
- Kirlin Co$19K$19K—
Where the givers live
72.7% of itemized individual money came from other states.
- Home state 27.3%
- Other states 72.7%
All 51 states and territories, ranked
Who writes the cheques
30.3% of Mike's itemized individual money came from women, from 33,878 women and 36,276 men.
- Women $2.9M
- Men $6.7M
By size of gift
The $3,500+ band brought in the most: 39% of itemized individual money.
- $200-$499$836K2,773 givers
Women $368K (1,211) · Men $468K (1,562)
- $500-$999$795K1,273 givers
Women $305K (469) · Men $490K (804)
- $1,000-$3,499$2.3M1,393 givers
Women $650K (390) · Men $1.6M (1,003)
- $3,500+$4.3M702 givers
Women $918K (152) · Men $3.3M (550)
- $7,000+$2.7M327 givers
Women $603K (77) · Men $2.1M (250)
Women's share over 11 cycles
Women's share moved from 23.7% in 2000 to 30.3% in 2026, lowest at 18.4% in 2008.
Track record
Mike has won 8 of 11 races on record between 2000 and 2026.
Peak cycle 2023–2024 raised $13.2M.
- Raised
- Spent
2026 MI Senate Class II
Raised $10.8M · spent $6.6M
Outraised by Abdul El-Sayed (D) with $14.4M
Won· Primary2024 MI Senate Class I
Raised $13M · spent $12.7M
Outraised by Elissa Slotkin (D) with $51.2M
Lost· General2014 MI House District 8
Raised $890K · spent $866K
Outraised by Mike Bishop (R) with $1.1M
No result· Primary
Amounts here cluster money from an organisation's employees, their families and its PAC, so they show industries and interests rather than individual names. For the named individual givers, see Mike's top donors. Campaign committee and leadership PAC combined · summary as of August 4, 2026 · transactions through July 17, 2026.