
Where the money comes from
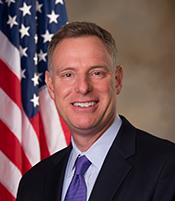
Scott H. Peters
U.S. Representative · California · 2025–2026 cycle
DemocraticPACs put up 62% of Scott's money this cycle, from 313 committees.
Raised
$2.1M
Spent
$1.6M
Cash on hand
$2.8M
Debts
$171K
Large individual gifts ($200+)
$362K · 17.7%
Small gifts (under $200)
$16K · 0.8%
PACs
$1.3M · 62%
Other
$397K · 19.4%
Self-funded
$2K · 0.1%
1%
Small gifts
of money came in gifts under $200
62%
PACs
of money came from PACs
38%
Out of state
of itemized individual money came from other states
32%
Health
of PAC money came from this sector
Compared with a typical House member
Across all 13 PAC sectors, 10 sit above what a typical House member takes from that sector.
Health
$400K vs $82K typical
+386%Finance, Insurance & Real Estate
$208K vs $146K typical
+42%Energy & Natural Resources
$145K vs $46K typical
+218%Communications/Electronics
$121K vs $34K typical
+257%Misc Business
$90K vs $48K typical
+89%Defense
$64K vs $29K typical
+117%Construction
$46K vs $27K typical
+72%Transportation
$44K vs $42K typical
+6%Labor
$39K vs $69K typical
−44%Lawyers & Lobbyists
$35K vs $16K typical
+110%Ideological/Single-Issue
$20K vs $139K typical
−86%Agribusiness
$17K vs $46K typical
−63%Other
$2K vs $2K typical
+10%
Bars to the right mean more than a typical House member; to the left, less.
Follow the PAC money
From PACs
$1.2M
Committees
313
Share of money
59.4%
vs a typical House member
—
- Business95%
- Labor3%
- Ideological/Single-Issue2%
13 sectors. Tap one to see the industries inside it, then every committee that gave.
Who gives
Biggest organisations
All 20 organisations whose employees, their families, or PAC gave. People on the left, the PAC on the right.
- Left: employees and their families
- Right: the organisation's PAC
- Arnold Ventures$51K$51K—
- RA Capital Management$40K$40K—
- General Atomics$39K$19K$20K
- Robbins, Geller et al$30K$30K—
- Shield AI$22K$14K$8K
- Amgen Inc$20K—$20K
- Abbott Laboratories$20K—$20K
- Arcadia$20K$20K—
- Deloitte LLP$15K—$15K
- National Multifamily Housing Council$15K—$15K
- Cox Enterprises$15K—$15K
- Sean N Parker Foundation$14K$14K—
Where the givers live
37.8% of itemized individual money came from outside California.
- California 62.2%
- Other states 37.8%
All 22 states and territories, ranked
Who writes the cheques
36.4% of Scott's itemized individual money came from women, from 250 women and 311 men.
- Women $284K
- Men $498K
By size of gift
The $3,500+ band brought in the most: 47% of itemized individual money.
- $200-$499$15K52 givers
Women $7K (24) · Men $8K (28)
- $500-$999$44K84 givers
Women $19K (37) · Men $25K (47)
- $1,000-$3,499$214K140 givers
Women $64K (44) · Men $149K (96)
- $3,500+$501K84 givers
Women $188K (27) · Men $313K (57)
- $7,000+$287K31 givers
Women $131K (13) · Men $157K (18)
Women's share over 8 cycles
Women's share moved from 39% in 2012 to 36.4% in 2026, peaking at 43.4% in 2020, lowest at 31.8% in 2022.
Track record
Scott has won 8 of 8 races on record between 2012 and 2026.
Peak cycle 2013–2014 raised $4.5M.
- Raised
- Spent
2026 CA House District 50
Raised $1.8M · spent $1.3M
Top opponent Aishwarya Mitra (D) with $17K
Won· Primary2024 CA House District 50
Raised $2.3M · spent $1.8M
Top opponent Timothy Bilash (D) with $28K
Won· General2022 CA House District 50
Raised $2.4M · spent $2.2M
Top opponent Joseph Rocha (D) with $435K
Won· General
Sits on
Amounts here cluster money from an organisation's employees, their families and its PAC, so they show industries and interests rather than individual names. For the named individual givers, see Scott's top donors. Campaign committee and leadership PAC combined · summary as of August 4, 2026 · transactions through July 17, 2026.